
Key Takeaways
- Set your floor before your target. Break-even ROAS is 1 ÷ gross margin — at 60% margin that is 1.67x, and every campaign below it is actively losing money.
- Real audit below: 16% of one account’s budget was sitting at 1.02x blended while the two best campaigns, running at 4.21x, shared under 9%.
- High CTR is not a quality signal. The account’s second-best CTR campaign returned 1.45x; its most expensive CPM campaign returned 4.72x.
- Reallocation does not transfer ROAS. A 4.7x campaign at ₹5K/month does not stay 4.7x at ₹25K. Plan for decay and move in steps.
- Use a 60/25/15 split — proven, scaling, experimental — and rebalance on a fixed monthly rhythm, not on panic.
Most performance marketing budget plans fail for the same reason: they start with a number from finance and work downwards, instead of starting with unit economics and working upwards. You get a spreadsheet that allocates ₹5 lakh across six channels, looks organised, and has no idea which rupee is making money. This playbook builds it the other way round — floor first, audit second, allocation third — using real numbers from a live D2C account.
Everything in this performance marketing budget playbook is execution-ready. No frameworks you cannot run on Monday morning.
Step 1: Find Your Floor Before You Set a Target
Almost every performance marketing budget starts with a target ROAS. Very few calculate break-even ROAS first, which is the only one that is not a matter of opinion.
The only formula that matters
Break-even ROAS = 1 ÷ Gross Margin %
At 50% margin → 2.00x · At 60% margin → 1.67x · At 70% margin → 1.43x
Gross margin here means after COGS, shipping, payment gateway fees and your actual return/RTO rate — not the margin on your price list.
Take a demi-fine jewellery brand with an average order value of ₹2,115 and a realistic 60% gross margin after returns. Break-even sits at 1.67x. Now the arithmetic gets uncomfortable:
- A campaign at 2.22x returns ₹2.22 revenue per ₹1 spent → ₹1.33 gross profit → ₹0.33 contribution per rupee.
- A campaign at 1.45x returns ₹0.87 gross profit per ₹1 spent → a loss of ₹0.13 per rupee, while looking like it “works”.
- A campaign at 0.44x loses ₹0.74 per rupee. Every day it runs, it costs you money faster than switching it off.
Write your break-even number at the top of every performance marketing budget sheet you build. It converts “this campaign is underperforming” into “this campaign is costing ₹X per day”, which is the version that gets approved for a pause.
Step 2: Audit Where Your Performance Marketing Budget Actually Sits
Here is 90 days of campaign-level data from a live fine-jewellery D2C account in India — ₹1.82 lakh of Meta spend, 191 purchases, 2.22x blended. Brand and campaign identifiers removed; the numbers are untouched.
| Campaign | Spend | Share | ROAS | CPA | CTR | Verdict |
|---|---|---|---|---|---|---|
| K — carousel, rings + video | ₹5,401 | 3.7% | 4.72x | ₹450 | 5.81% | Starved |
| F — single category | ₹7,269 | 5.0% | 3.84x | ₹661 | 4.65% | Starved |
| B — statement pieces | ₹36,076 | 25.0% | 3.34x | ₹722 | 4.31% | Correctly funded |
| A — broad catalogue | ₹36,159 | 25.1% | 2.94x | ₹670 | 4.31% | Correctly funded |
| C — catalogue variant | ₹11,926 | 8.3% | 2.10x | ₹1,084 | 3.13% | Marginal |
| E — video push | ₹8,959 | 6.2% | 2.06x | ₹1,120 | 2.57% | Marginal |
| D — category, ABO | ₹9,953 | 6.9% | 2.03x | ₹905 | 2.94% | Marginal |
| I — sale + offer | ₹5,782 | 4.0% | 1.99x | ₹964 | 4.23% | Marginal |
| G — rings | ₹7,229 | 5.0% | 1.45x | ₹904 | 5.25% | Below break-even |
| J — catalogue variant 2 | ₹5,744 | 4.0% | 1.44x | ₹1,436 | 3.09% | Below break-even |
| H — first-touch, all products | ₹6,614 | 4.6% | 0.45x | ₹2,205 | 3.46% | Burning cash |
| L — statement variant | ₹3,163 | 2.2% | 0.44x | ₹3,163 | 2.61% | Burning cash |
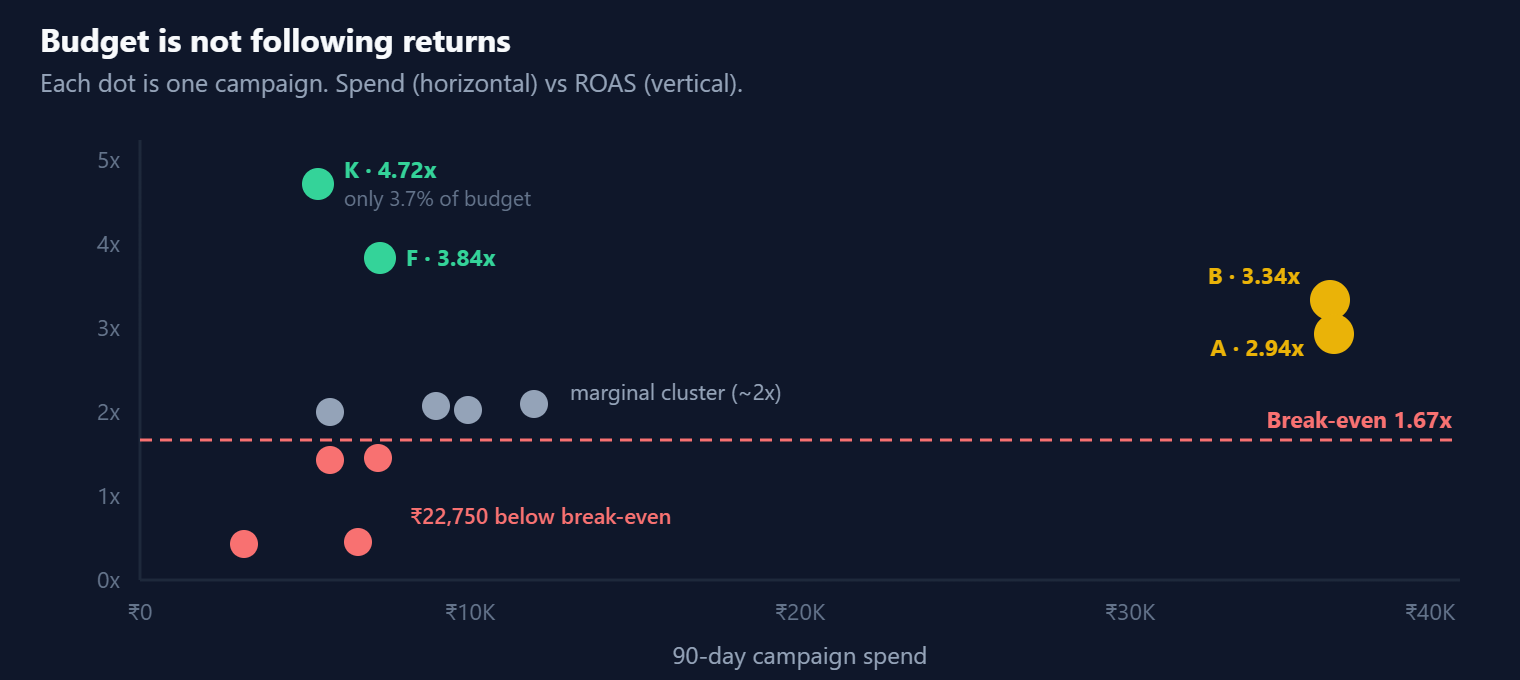
Three things jump out of that performance marketing budget chart, and all three are common.
The best campaigns are starved
Campaigns K and F returned a blended 4.21x on ₹12,670 — under 9% of the audited spend. Meanwhile ₹22,750, close to 16%, sat in campaigns returning a blended 1.02x. At a 60% margin, that 1.02x bucket produced roughly ₹13,900 of gross profit against ₹22,750 of media. It was quietly costing about ₹8,800 over the period.
High CTR fooled the account
Campaign G had the second-highest CTR in the account at 5.25% — and returned 1.45x, below break-even. People clicked enthusiastically and did not buy. That is a creative-to-product mismatch: the ad promised something the product page did not deliver, or it attracted browsers rather than buyers. CTR measures interest in the ad, never intent to purchase. I wrote about where that gap actually closes in five landing page frameworks that double conversion rates.
The most expensive impressions were the best ones
Campaign K ran the highest CPM in the account at ₹573 — roughly three times the account average — and delivered the lowest CPA at ₹450 and the best ROAS at 4.72x. Expensive attention from the right people beat cheap attention from the wrong people, by a wide margin. If your optimisation instinct is to chase CPM down, this is the counter-example to keep in your pocket.
Step 3: Reallocate — But Do Not Believe Your Own Spreadsheet
The obvious performance marketing budget move is to pull ₹22,750 out of the losing bucket and push it into K and F. On paper, at 4.21x, that turns ₹23,179 of revenue into ₹95,800. A ₹72,000 swing. Put that in a deck and you will get a promotion.
It will not happen, and you should say so before anyone else does.
So reallocate your performance marketing budget in steps, not in one move:
- Kill the clear losers immediately. Anything under 0.5x against a 1.67x break-even is not a test, it is a leak. That frees ₹9,777 with no downside risk.
- Diagnose, do not kill, the near-misses. Campaigns at 1.44–1.45x are close enough that a landing page or offer fix may clear break-even. Give them two weeks and one specific hypothesis each.
- Scale the winners 20–30% per week. Not 300% overnight. Watch CPA, not ROAS, as you go — CPA reacts faster and is not distorted by a single large order.
- Stop at the first sign of decay. When CPA crosses your break-even CPA, you have found that campaign’s efficient ceiling. Hold it there. That ceiling is a real, useful number.
Step 4: The 60/25/15 Allocation Model
Once the obvious waste is gone, your performance marketing budget needs a structure that survives a bad month. The split that holds up across D2C accounts:
| Bucket | Share | What goes in it | Rule |
|---|---|---|---|
| Proven | 60% | Campaigns at or above target ROAS for 30+ days | Never cut mid-month. Protected. |
| Scaling | 25% | Winners being pushed toward their ceiling | Weekly +20–30%. Stop on CPA breach. |
| Experimental | 15% | New creative angles, audiences, formats, channels | Expected to lose. That is the point. |
The 15% experimental bucket is the one everyone cuts first and should cut last. It is the only part of the budget producing next quarter’s proven campaigns. Protect it in writing, because the month you cut it is the month your pipeline of winners stops refilling — and you will not feel that for 60 days, by which point nobody connects the two.
Step 5: An Omnichannel Attribution Framework You Can Actually Run
The moment you spend on more than one platform, every platform claims the same sale. Add up Meta’s reported revenue, Google’s reported revenue and your Shopify revenue and you will find the first two exceed the third. This is not fraud; each platform counts conversions it influenced under its own window.
You do not fix that with a better attribution model. You fix it with a reconciliation habit:
- Anchor on blended CAC. Total marketing spend ÷ total new customers, pulled from your store, not from any ad platform. This is the number that cannot be double-counted.
- Calculate your platform inflation factor. Sum of all platform-reported revenue ÷ actual revenue. If Meta and Google together claim ₹6L and you booked ₹4L, your factor is 1.5. Divide every platform ROAS by it for a sane comparison.
- Run one geo holdout per quarter on your largest channel. Withhold spend in matched regions, compare the delta. It is the only method that proves causation rather than describing correlation.
- Fix the signal before the model. Server-side events via the Conversions API and clean Google Ads conversion tracking recover more accuracy than any attribution software will.
Worth knowing: the platforms are building this in themselves. Google’s Meridian-powered budgeting tools in Analytics explicitly harmonise marketing mix modelling, multi-touch attribution and incrementality tests. When the ad platform ships its own incrementality layer, that is a fairly direct admission about how much weight its attributed ROAS column should carry.
Step 6: The Operating Rhythm
A performance marketing budget is only as good as the cadence that enforces it. Most accounts are over-managed daily and under-managed quarterly.
| Cadence | You look at | You are allowed to change |
|---|---|---|
| Daily (10 min) | Spend pacing, delivery errors, CPA vs break-even CPA | Nothing, unless something is broken or CPA has doubled |
| Weekly (45 min) | Campaign CPA and ROAS, creative fatigue, funnel step rates | Scale winners +20–30%, pause confirmed losers, ship new creative |
| Monthly (2 hrs) | Bucket split vs 60/25/15, blended CAC, new-customer share | Rebalance buckets, promote experiments to scaling |
| Quarterly (half day) | Geo holdout results, platform inflation factor, channel mix | Shift budget between channels, reset targets |
The “allowed to change” column is the important one. Daily optimisation on a Meta account running automated delivery mostly damages learning. Give the system room, then intervene on a schedule you decided in advance rather than on whatever the dashboard did overnight.
The One-Page Budget Sheet
Everything above compresses into eight lines. Build this performance marketing budget sheet before anything else in your 2027 plan.
For the jewellery account above: 60% margin, 1.67x break-even, ₹1,269 break-even CPA, 2.34x target, ₹60K monthly split ₹36K/₹15K/₹9K. Four of its twelve campaigns were running above the ₹1,269 CPA ceiling. Nobody had written the ceiling down, so nobody noticed.
Once the allocation is right, the constraint moves to execution speed — mostly how fast you can produce and test creative. That is covered in my Meta Ads scaling guide, and the Performance Max budget panel now surfaces its own low/medium/high recommendations with forecasts, which are useful as a sanity check against your own numbers — never as a replacement for them.
Frequently Asked Questions
How do I calculate break-even ROAS correctly?
Divide 1 by your true gross margin — after COGS, shipping, payment gateway charges and your actual return or RTO rate, not the margin on your price list. A brand that believes it runs at 65% margin but absorbs a 15% RTO rate is closer to 55%, which moves break-even from 1.54x to 1.82x. That gap is where most “profitable” D2C accounts quietly lose money.
What percentage of budget should go to testing?
Around 15% of your performance marketing budget for an established account. Below 10% your pipeline of future winners dries up; above 25% you are gambling rather than testing. The bucket should be expected to lose money — if your experimental budget is profitable, you are not testing anything genuinely new.
Should I pause a campaign the moment it drops below break-even?
Not on one day’s data. Use a two-threshold rule: anything below roughly 0.5x against break-even gets paused immediately, because no realistic fix closes that gap. Anything within 20% of break-even gets two weeks and one specific hypothesis — usually the landing page or the offer, rarely the targeting.
How much can I scale a winning campaign before it breaks?
Increase by 20–30% per week and watch CPA rather than ROAS, since CPA reacts faster and is not skewed by one unusually large order. Most campaigns hit an efficient ceiling somewhere between 2x and 4x their starting spend. Expect the ROAS at that ceiling to be meaningfully lower than it was at small scale — that is normal, not a failure.
My platform ROAS and my actual revenue do not match. What do I do?
Calculate your inflation factor — total platform-reported revenue divided by actual booked revenue — and divide every platform ROAS by it before comparing channels. Then fix your signal quality with server-side conversion tracking. Do not try to reconcile the gap by switching attribution models; that changes the story without changing the facts.
Does a high CTR mean a campaign is working?
No. In the account analysed here, the campaign with the second-highest CTR at 5.25% returned 1.45x — below break-even. CTR measures how compelling the ad is, not whether the person intends to buy. Treat an unusually high CTR with a weak CPA as a signal that the ad is over-promising relative to the product page.
Start Here
Open your ad account and sort your performance marketing budget by spend. Then sort by ROAS. If the order changes dramatically — and it almost always does — your budget is following history rather than returns, and you have found your highest-leverage work for the quarter.
Fix that first. Everything else in a performance marketing budget for 2027 is downstream of getting the money in the right place.